Back
3 Mar 2020
USD/INR New York Price Analysis: Dollar trading in fresh 2020 highs vs. rupee near 73.50 level
- USD/INR bull trend remains intact above the 72.40 level.
- The level to beat for bulls is the 73.50 level.
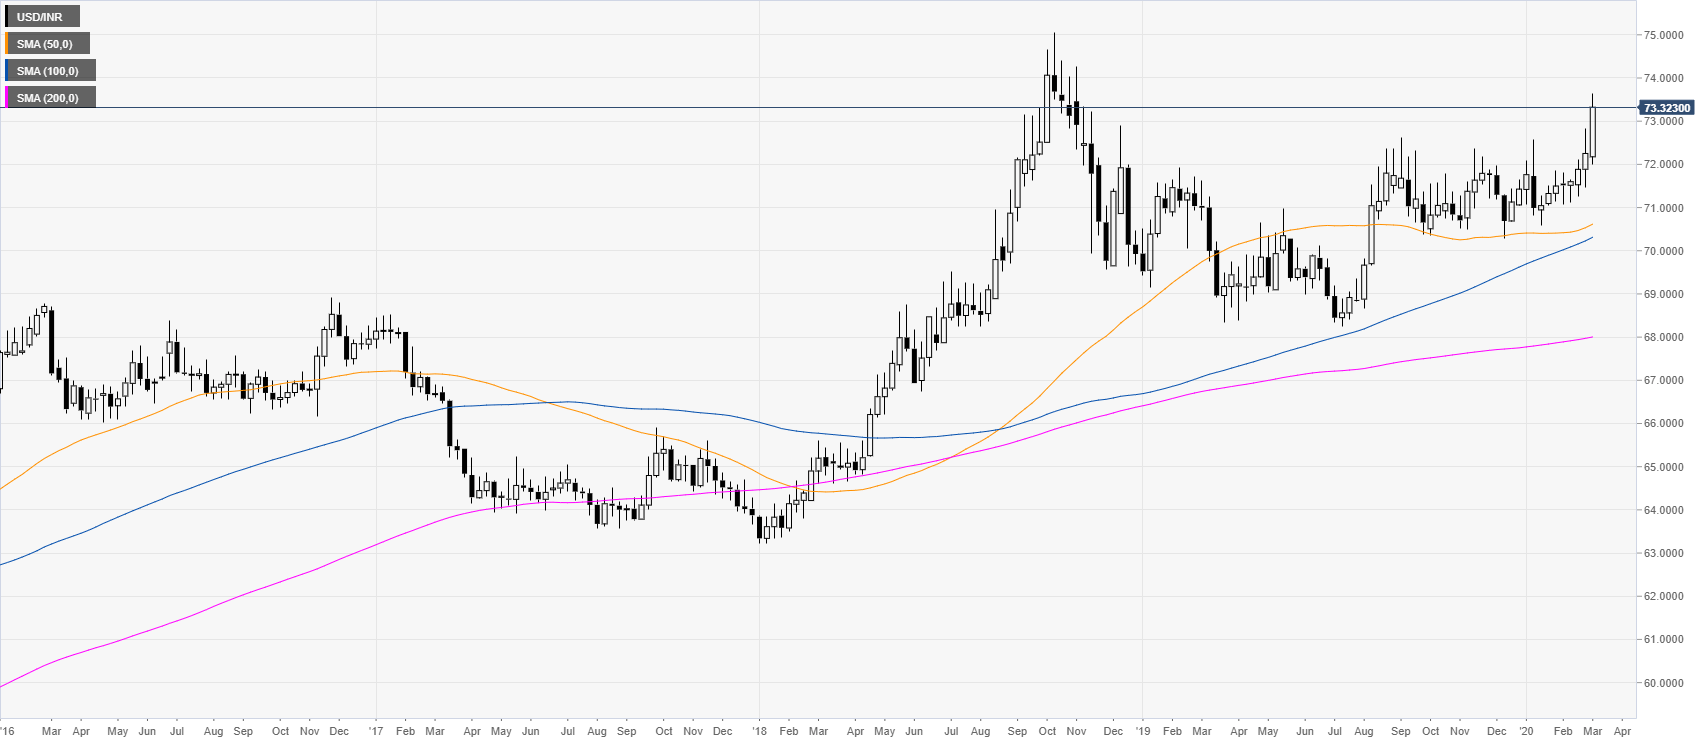
USD/INR weekly chart
After the 2018 bull-market, the spot has been consolidating in a rectangle pattern for the main part of 2019. USD/INR is trading above the main weekly simple moving averages (SMAs), suggesting a bullish bias in the long term.
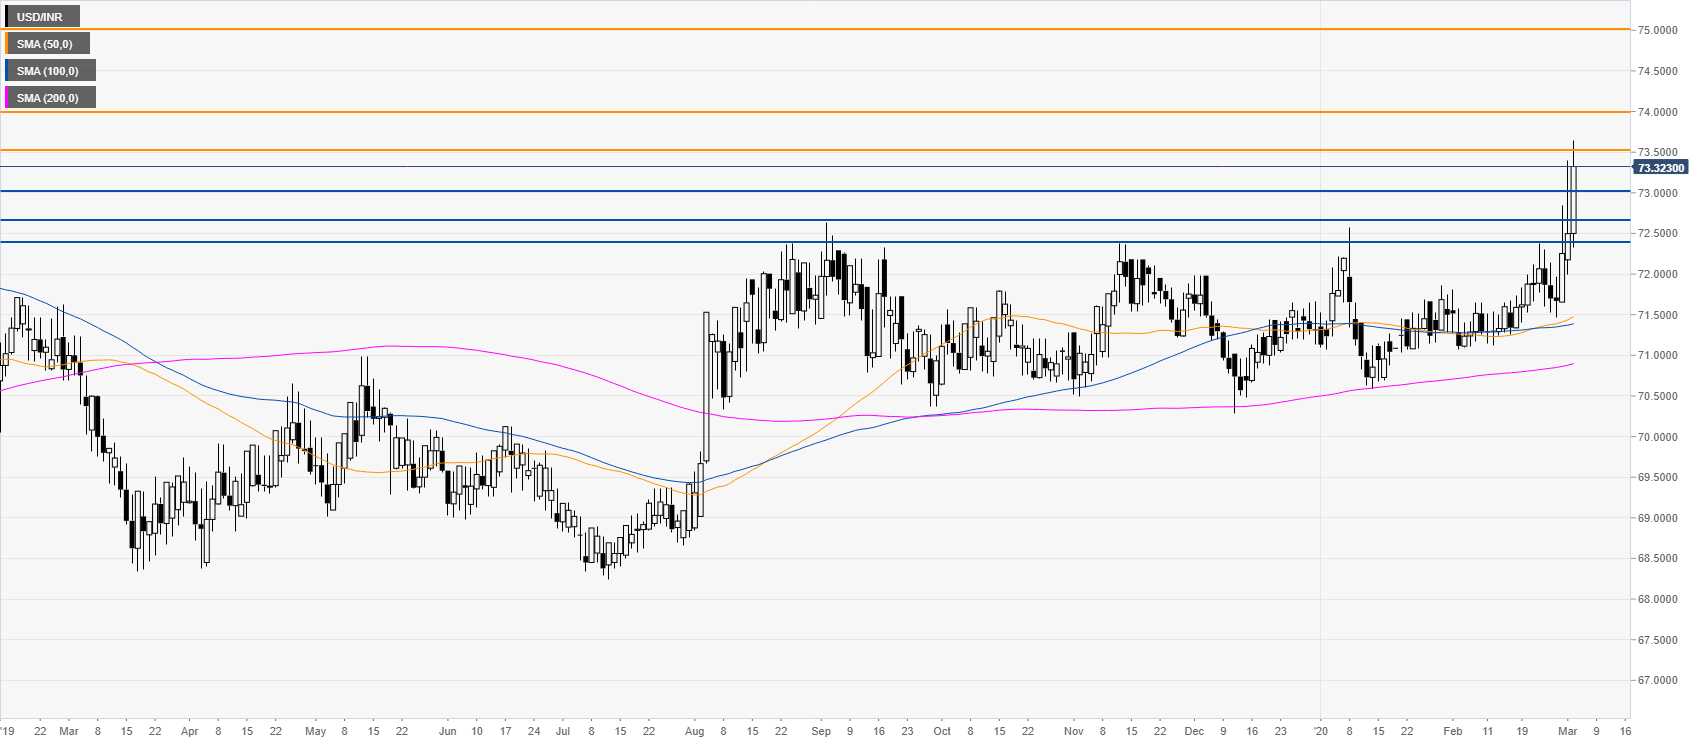
USD/INR daily chart
USD/INR is trading in fresh 2020 highs just above the 73.00 figure. A break beyond the 73.50 resistance would lead to extra gains towards the 74.00 and 75.00 figures. Support is seen near the 73.00 figure followed by the 72.65 and 72.40 price levels.
Additional key levels