Back


24 Feb 2020
US Dollar Index Price Analysis: DXY off 2020 highs, under pressure near 99.20 level
- DXY is starting the week on the back foot resuming the drop of last Friday.
- The level to beat for sellers id the 99.20 support.
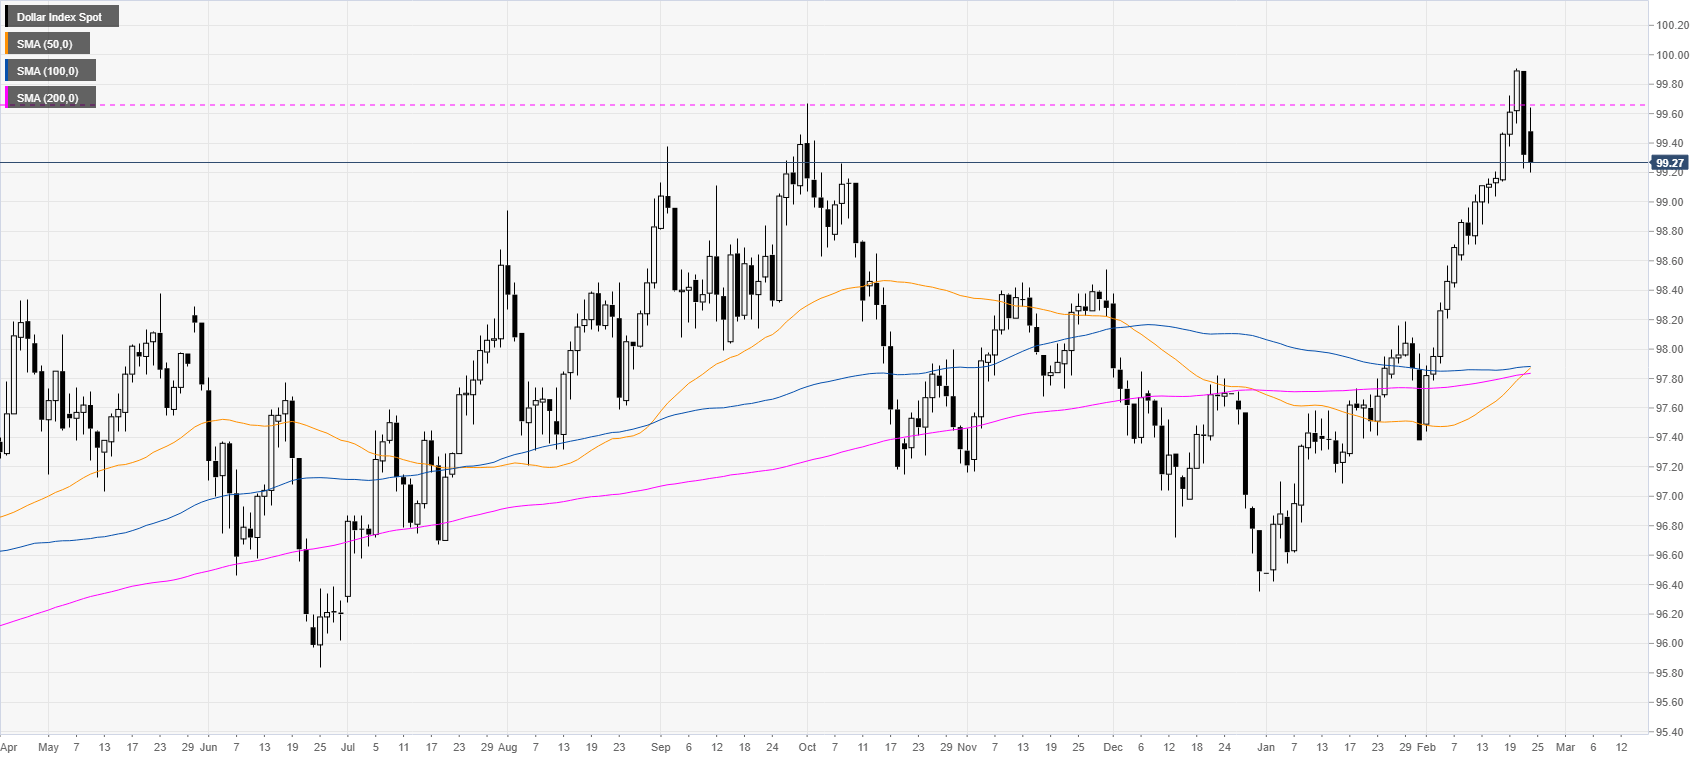
DXY daily chart
The US dollar index (DXY) is pulling back down below the 2019 high at 99.67 level. DXY is on the back foot after a long bullish run.

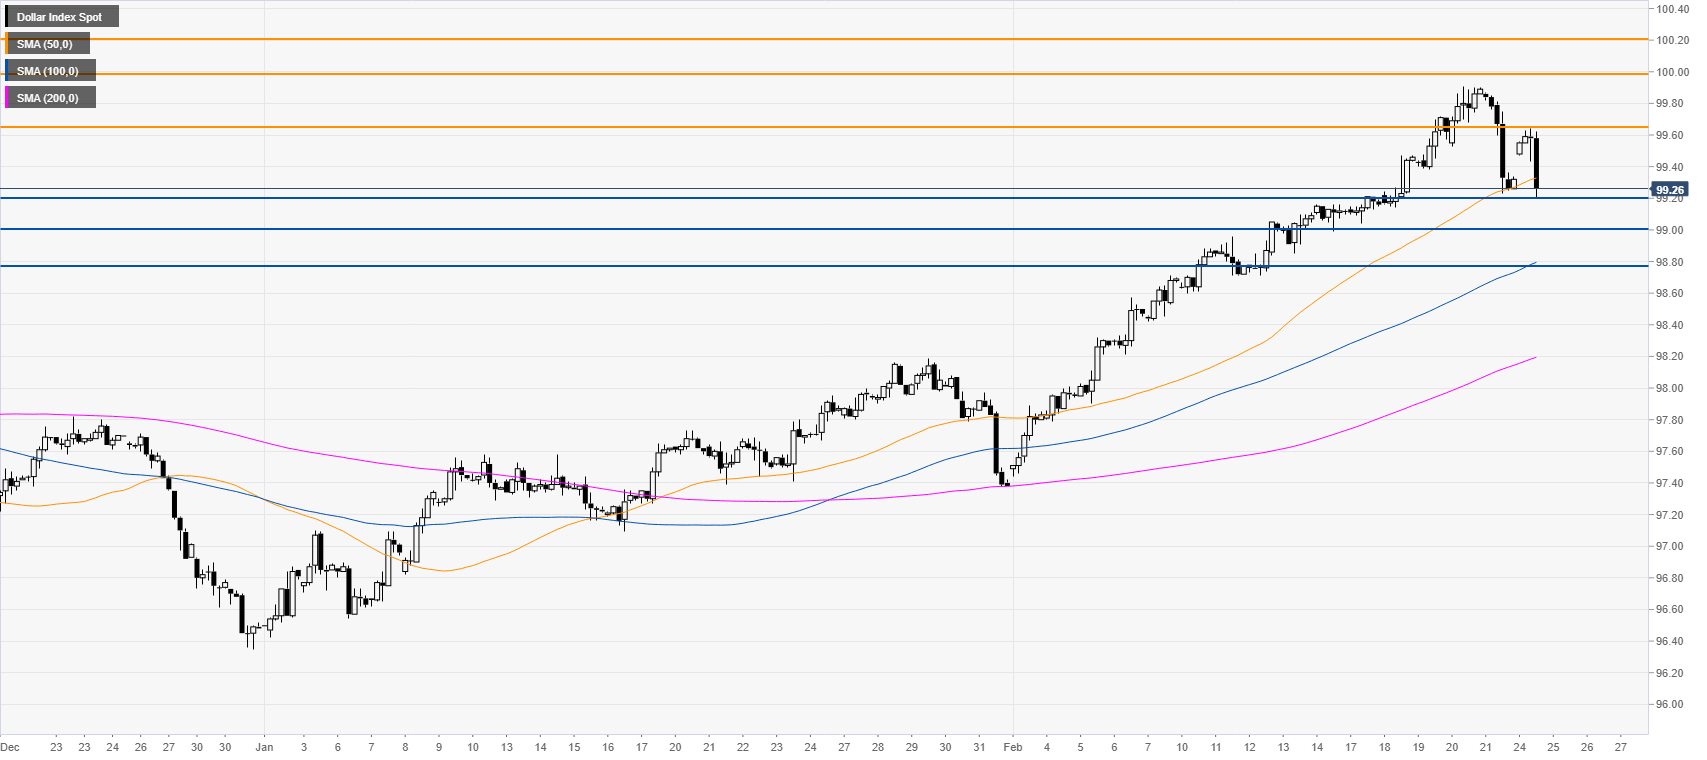
DXY four-hour chart
The market is pressured near last week’s lows and the 50 SMA. Bears are looking for a break below the 99.20 support and a potential extension to the 99.00 and 98.80 levels. Bullish attempts can find resistance near 99.65 and 100.00 figure.

Additional key levels
